


India's Stock Market Just Hit a Record.
Here's the Story Behind the Numbers — Told.

Something remarkable happened in India's stock market between August 2024 and April 2026. It wasn't just the Nifty or Sensex hitting new highs — those headlines come and go. What's truly remarkable is the sheer amount of money that started changing hands every single trading day. And that number — called cash market turnover — tells a far more honest story about market health than any index ever could.
First — What Exactly Is Cash Market Turnover?
Every day, millions of Indians open their trading apps and mutual fund platforms. They buy shares listed on the BSE and NSE, sell positions, and switch between funds. By the end of the day, all that activity adds up to one big number: total cash market turnover.
Average daily turnover is simply that total divided by the number of trading days in the month. Think of it as the heartbeat of the equity market. When it's strong, the market is buzzing — people are actively participating, money is moving freely, and stock prices are being discovered fairly. When it weakens, something is usually wrong.

Most people track where the Nifty closed or whether the Sensex hit a record. But indices only tell you about prices. Market volume tells you about participation. And participation, it turns out, is a much more honest signal of whether the Indian stock market is truly healthy — or just putting on a show.
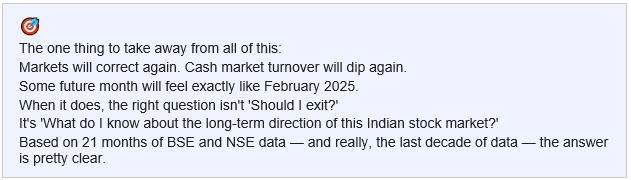
Over 21 months — August 2024 to April 2026 — India's average daily turnover told a story with a clear beginning, a painful middle, and a genuinely surprising end. Let's walk through it, month by month.
Act I: The Market Was Flying — Then Quietly Lost Steam
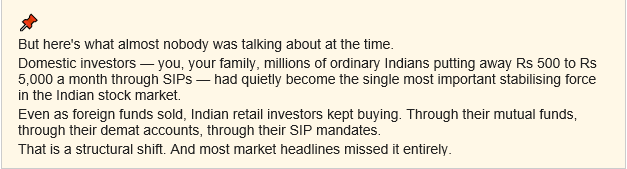
August 2024. General elections were over. Policy direction was clear. Company earnings were strong. Foreign Institutional Investors — or FIIs, which are large global funds that invest in Indian stocks — were actively buying. Monthly SIP (Systematic Investment Plan) contributions — the small, regular amounts that crores of ordinary Indians invest in mutual funds every month — crossed Rs 23,000 crore for the very first time.
Average daily cash market turnover hit Rs 1,26,000 crore—the highest level in years. The market didn't just feel good — it felt like it had earned the right to feel good.
And then, quietly, things started slipping. September: Rs 1,21,000 crore. October: Rs 1,04,500 crore. November and December settled at around Rs 1,02,000 crore. The market volume was holding, but the energy had faded.
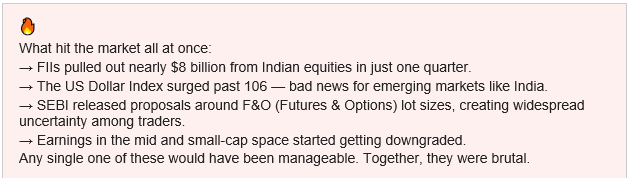
Why? The US dollar was getting stronger, and American bond yields were climbing. When that happens, global money tends to flow back toward the safety of US assets — and away from emerging markets like India. FII selling picked up pace.
Act II: February 2025 — The Month the Market Hit Its Low
January 2025: Rs 91,000 crore. A 10.8% drop in a single month.
February 2025: Rs 85,000 crore.
That's a 33% fall from the August 2024 peak. In just six months.
To put it in plain terms: Rs 85,000 crore is where India's equity market was trading during the quiet post-COVID recovery period of early 2023. All those new demat accounts opened, all those new retail investors who had entered the market — in terms of raw activity, it looked like none of it had made a difference.
If you were actively investing in February 2025, you felt this in your bones. Stocks were harder to buy or sell without prices moving against you. The BSE and NSE cash segments felt thin and fragile.
And yet — this is the part that usually gets ignored — the market didn't completely fall apart. The floor held around Rs 85,000 crore. It held because every single month, regardless of what FIIs were doing, millions of Indians were quietly continuing their SIP investments. The equity market had a shock absorber it had never had before. The retail investor had become the backbone.

Act III: The Comeback Nobody Expected — At That Speed
September 2025. Something shifted. It rarely comes down to a single cause — and this was no different. But the direction changed, and this time, it didn't reverse.
September: Rs 97,500 crore. October: Rs 1,02,000 crore. November: Rs 1,02,000 crore. December dipped to Rs 91,000 crore — completely normal year-end behaviour as big institutions book profits. And then came January 2026.

February: Rs 1,13,000 crore. March: Rs 1,25,000 crore. April 2026: Rs 1,33,000 crore. A brand new record for average daily cash market turnover in India's history.
From the February 2025 low to the April 2026 record: a 56% surge. In fourteen months.
The Full Scorecard — All 21 Months, No Hiding
Every month. Every number. Highlighted in green at the top (the record), red at the bottom (the trough). The period average was roughly Rs 1,04,500 crore per day.

Three Big Things This Data Quietly Tells Us
1. India's Equity Market No Longer Depends on Foreign Investors to Stay Healthy
For years, the single most important question in the Indian stock market was: What are FIIs doing? When foreign institutional investors bought, the market went up. When they sold, it fell. Simple as that.
That relationship still exists — but it no longer tells the whole story. In 2024–25, FIIs pulled out billions of dollars. The equity market corrected, yes. But it didn't break. Domestic Institutional Investors — or DIIs, meaning Indian mutual funds and insurance companies — absorbed a massive chunk of that selling, funded by the unstoppable flood of SIP money from retail investors.

2. The Stock Market Has a Seasonal Rhythm — And It's Very Predictable
Look at the data carefully. Every July–August, market volume dips. Every January–March, it surges. December always sees a quiet slowdown as big funds do year-end accounting. This pattern repeats with almost clockwork consistency across both FY25 and FY26.
What this means for you as an investor: when BSE and NSE activity slows down, and the financial news feels alarming, it might just be the calendar doing its thing — not a sign of something structurally broken in the Indian stock market. Patience, in those moments, is the strategy.
And notice this too: FY26's weakest quarter was still higher than FY25's equivalent quarter. The baseline of daily turnover keeps rising year after year. That's the compounding effect of 3 million new demat accounts being opened every single month.
3. When the RBI Cuts Interest Rates, More Money Flows into the Stock Market
The Reserve Bank of India started cutting interest rates in October 2025. The equity market volume recovery began in September 2025. Coincidence? Partly — but the mechanism is real.
Here's the simple version: when interest rates fall, your fixed deposit earns less interest. Your loan EMI drops, leaving you with more money at the end of each month. Suddenly, keeping everything in an FD feels less attractive. Some of that money — slowly, steadily — finds its way into mutual funds and direct stocks. More money entering the equity market means more trading activity. Cash market turnover and market volume go up.

The Risks — Because Every Story Needs Both Sides
April 2026 just broke the record. It's tempting to draw a straight line to Rs 2,00,000 crore and declare it inevitable. Markets don't work that way.
Here's what could genuinely throw things off course:
A US Federal Reserve surprise: If American inflation heats up again and the Fed hikes rates, global money flows out of emerging markets like India almost overnight. The dollar strengthens, FII selling restarts, and the Indian stock market feels the pressure immediately.
A bad monsoon: It sounds old-fashioned, but India's food prices and rural economy are still heavily linked to rainfall. Poor rains drive up food inflation, delay RBI rate cuts, and dampen the mood of millions of rural consumers. None of that is good for equity market volumes.
Expensive valuations: The Nifty is not cheap right now. If company earnings disappoint over the next few quarters — if the growth story doesn't keep delivering — the market can reprice sharply downward, and daily turnover will follow it down.

The Bottom Line — And It's a Good One
Twenty-one months. Three phases. One all-time record. And underneath all the noise and the numbers, one very simple truth: more Indians are investing in the equity market than ever before. Through SIPs, through demat accounts, through mutual funds listed on BSE and NSE. And they are not stopping.
The fall from Rs 1,26,000 crore to Rs 85,000 crore in average daily cash market turnover was real, and it was painful. But here's what it didn't do: it didn't trigger a mass panic. SIP cancellations stayed low. Demat account openings continued. The wave of retail investor exits that used to amplify every Indian market downturn was — this time — notably, encouragingly absent.
That is the real headline from this 21-month story. Not the record in April 2026. Not even the 56% recovery. It's the fact that when things got genuinely difficult, millions of first-time investors — people putting away a few hundred or a few thousand rupees a month — held their nerve. They stayed invested. And they were rewarded for it.
Rs 1,00,000 crore was once the ceiling.
It is now the floor.
That one sentence tells you everything about where India's equity market is headed.
Disclaimer: This article is for informational and educational purposes only and does not constitute investment advice. All data sourced from publicly available BSE, NSE, and Moneycontrol figures. Past market trends are not indicative of future performance.
Disclaimer
What's Trending
Missed Profit Feels Like Loss | Trading Psychology for Beginners
January 19, 2026
50 Small Money Moves That Build a Big Financial Future
September 29, 2025
ONCE UPON A STOCK: THE TATA CAPITAL IPO STORY
October 7, 2025
Recent Blog


.jpeg)
.jpeg)


Open your GoPocket Account within 5 minutes.
Have any queries?
Get support
Investing and trading is made simple, affordable and accessible for every Indian.


© Made with ❤️ in Coimbatore, India | Copyright © 2023 onwards, GoPocket.