


CANDLESTICK REVERSAL PATTERNS EVERY BEGINNER TRADER SHOULD KNOW (PART 2)
In the previous section, we introduced the basics of candlestick reversal patterns and how they signal shifts in market momentum. Now, let’s continue exploring more important reversal setups that beginner traders should understand.
Candlestick patterns help traders understand when market momentum might change. Each candle shows the battle between buyers and sellers during a specific period. When certain shapes appear after a trend, they can suggest that the trend may slow down or reverse. These patterns are not guarantees, but they can provide useful clues when combined with confirmation, volume, and tools like RSI (Relative Strength Index), which helps show whether a market may be overbought or oversold.
Below are 5 common candlestick reversal patterns explained in simple, practical terms.
DARK CLOUD COVER & PIERCING PATTERN (THE 50% RULE)
These patterns signal a possible reversal when the second candle moves more than halfway into the body of the first candle.
DARK CLOUD COVER (THE STORM)
Snapshot: A strong uptrend may start to reverse.
Spot It:
• Day 1: A strong green candle during rising prices.
• Day 2: A red candle opens higher (a price gap) but then falls sharply.
• It closes below the midpoint (50%) of the first candle’s body.
Why It Matters:
The market opened with optimism, but sellers quickly took control and pushed prices down into the previous day’s gains. This can trap buyers and signal weakening momentum.
Trade Trigger:
Consider confirmation if the next candle continues moving lower.
PIERCING PATTERN (THE REBOUND)
Snapshot: A falling market may be stabilising.
Spot It:
• Day 1: A strong red candle during a decline.
• Day 2: A green candle opens lower but rallies strongly.
• It closes above the midpoint (50%) of the previous red candle.
Why It Matters:
Sellers pushed prices lower at first, but buyers stepped in at lower levels and recovered a large portion of the previous losses.
Trade Trigger:
Consider waiting for a third candle to confirm the upward move before entering a trade.

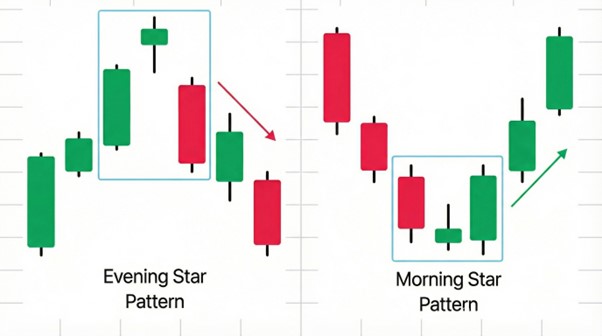
MORNING & EVENING STARS (THE THREE-DAY TURNS)
These patterns tell a simple three-step story: strong momentum, a pause, and then a reversal.
MORNING STAR (THE SUNRISE)
Snapshot: A new uptrend may be beginning.
Spot It:
• Day 1: A long red candle showing strong selling pressure.
• Day 2: A small candle showing indecision.
• Day 3: A strong green candle that moves well into the first candle’s body.
Why It Matters:
Selling pressure slows down, then buyers step in and push prices higher. This often signals that momentum is shifting upward.
Trade Trigger:
Higher volume on the third candle can strengthen the signal before considering a trade.
EVENING STAR (THE SUNSET)
Snapshot: A strong uptrend may be ending.
Spot It:
• Day 1: A long green candle during rising prices.
• Day 2: A small candle showing hesitation.
• Day 3: A strong red candle moving lower into the first candle’s body.
Why It Matters:
Buyers pushed prices higher, but momentum slowed, and sellers stepped in strongly. This can signal the start of a downward move.
Trade Trigger:
Watch for the price to move below the third candle's low to confirm the reversal.
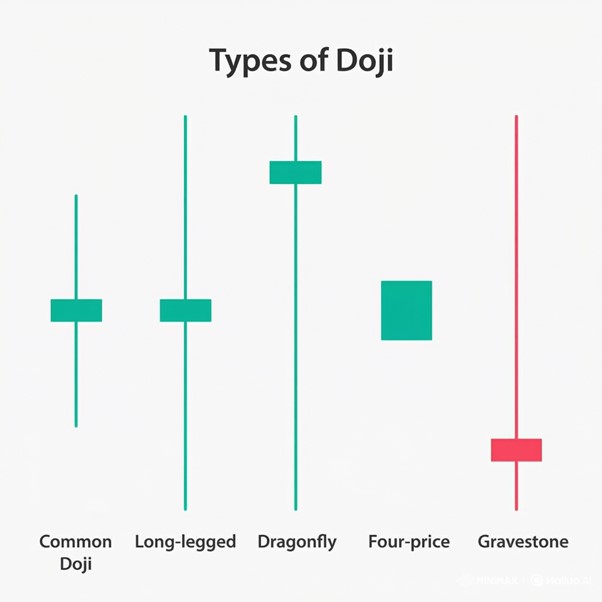
DOJI (THE TIE)
Snapshot: The market is undecided.
Spot It:
• Looks like a cross or plus sign.
• The open and close prices are almost the same.
• The body is extremely small or flat.
Why It Matters:
Buyers and sellers ended the session in balance. When this appears after a strong trend, it may suggest the trend is losing momentum.
Trade Trigger:
A Doji alone is not a signal. Wait for the next candle to show the direction of the breakout.
WRAP-UP (PART 2)
These additional reversal patterns build on the foundations discussed earlier and help you read market sentiment with more confidence. When combined with the patterns covered in Part 1, they give you a stronger framework to identify potential turning points.
Candlestick patterns can help traders understand shifts in market sentiment, but they should not be used alone. Waiting for confirmation and checking indicators like volume or RSI can improve decision-making. Over time, recognising these patterns becomes easier and helps traders read market behaviour more clearly.

Disclaimer: This content is for educational purposes only and does not constitute financial advice.
Disclaimer
What's Trending
Lifestyle Inflation Is Silently Killing Your Wealth
April 2, 2026
What is SME IPO? How Does it Work & Eligibility Criteria
August 14, 2024
NSE Commodities on GoPocket: What It Means & Why It Matters
February 13, 2026
Recent Blog


.jpeg)
Blog
Recent Blogs
.jpeg)
.jpeg)
.jpeg)

Open your GoPocket Account within 5 minutes.
Have any queries?
Get support
Investing and trading is made simple, affordable and accessible for every Indian.


© Made with ❤️ in Coimbatore, India | Copyright © 2023 onwards, GoPocket.