


CANDLESTICK REVERSAL PATTERNS EVERY BEGINNER TRADER SHOULD KNOW
Candlestick patterns help traders understand when market momentum might change. Each candle shows the battle between buyers and sellers during a specific period. When certain shapes appear after a trend, they can suggest that the trend may slow down or reverse. These patterns are not guarantees, but they can provide useful clues when combined with confirmation, volume, and tools like RSI (Relative Strength Index), which helps show whether a market may be overbought or oversold.
Below are the common candlestick reversal patterns explained in simple, practical terms.
1. BULLISH & BEARISH ENGULFING (THE TOTAL TAKEOVERS)
These are strong reversal patterns where one side completely overtakes the other. They are popular because they are easy to recognise on charts.
BULLISH ENGULFING (THE COMEBACK)
Snapshot: A downtrend may be ending as buyers begin to take control.
Spot It:
• Day 1: A small red candle appears during a downtrend.
• Day 2: A larger green candle opens lower but moves up strongly.
• The green candle’s body completely covers (engulfs) the previous red candle’s body.
WHY IT MATTERS:
Sellers controlled the market, but buyers stepped in with strong demand, pushing prices higher than where they began the previous day. This shift often suggests momentum may be turning upward.
TRADE TRIGGER:
Consider entering only if the next candle closes above the engulfing candle. Higher trading volume on the second candle can make the signal more reliable.
BEARISH ENGULFING (THE CRASH)
Snapshot: A rising trend may be weakening as sellers step in.
Spot It:
• Day 1: A small green candle during an uptrend.
• Day 2: A large red candle opens higher but drops sharply.
• The red candle’s body fully covers the previous green candle’s body.
Why It Matters:
Buyers pushed prices higher at first, but sellers quickly reversed the move and erased the gains. This shift can signal that downward momentum may follow.
Trade Trigger:
Consider confirmation only if the next candle closes below the engulfing candle. If RSI is already high, the signal can appear stronger.

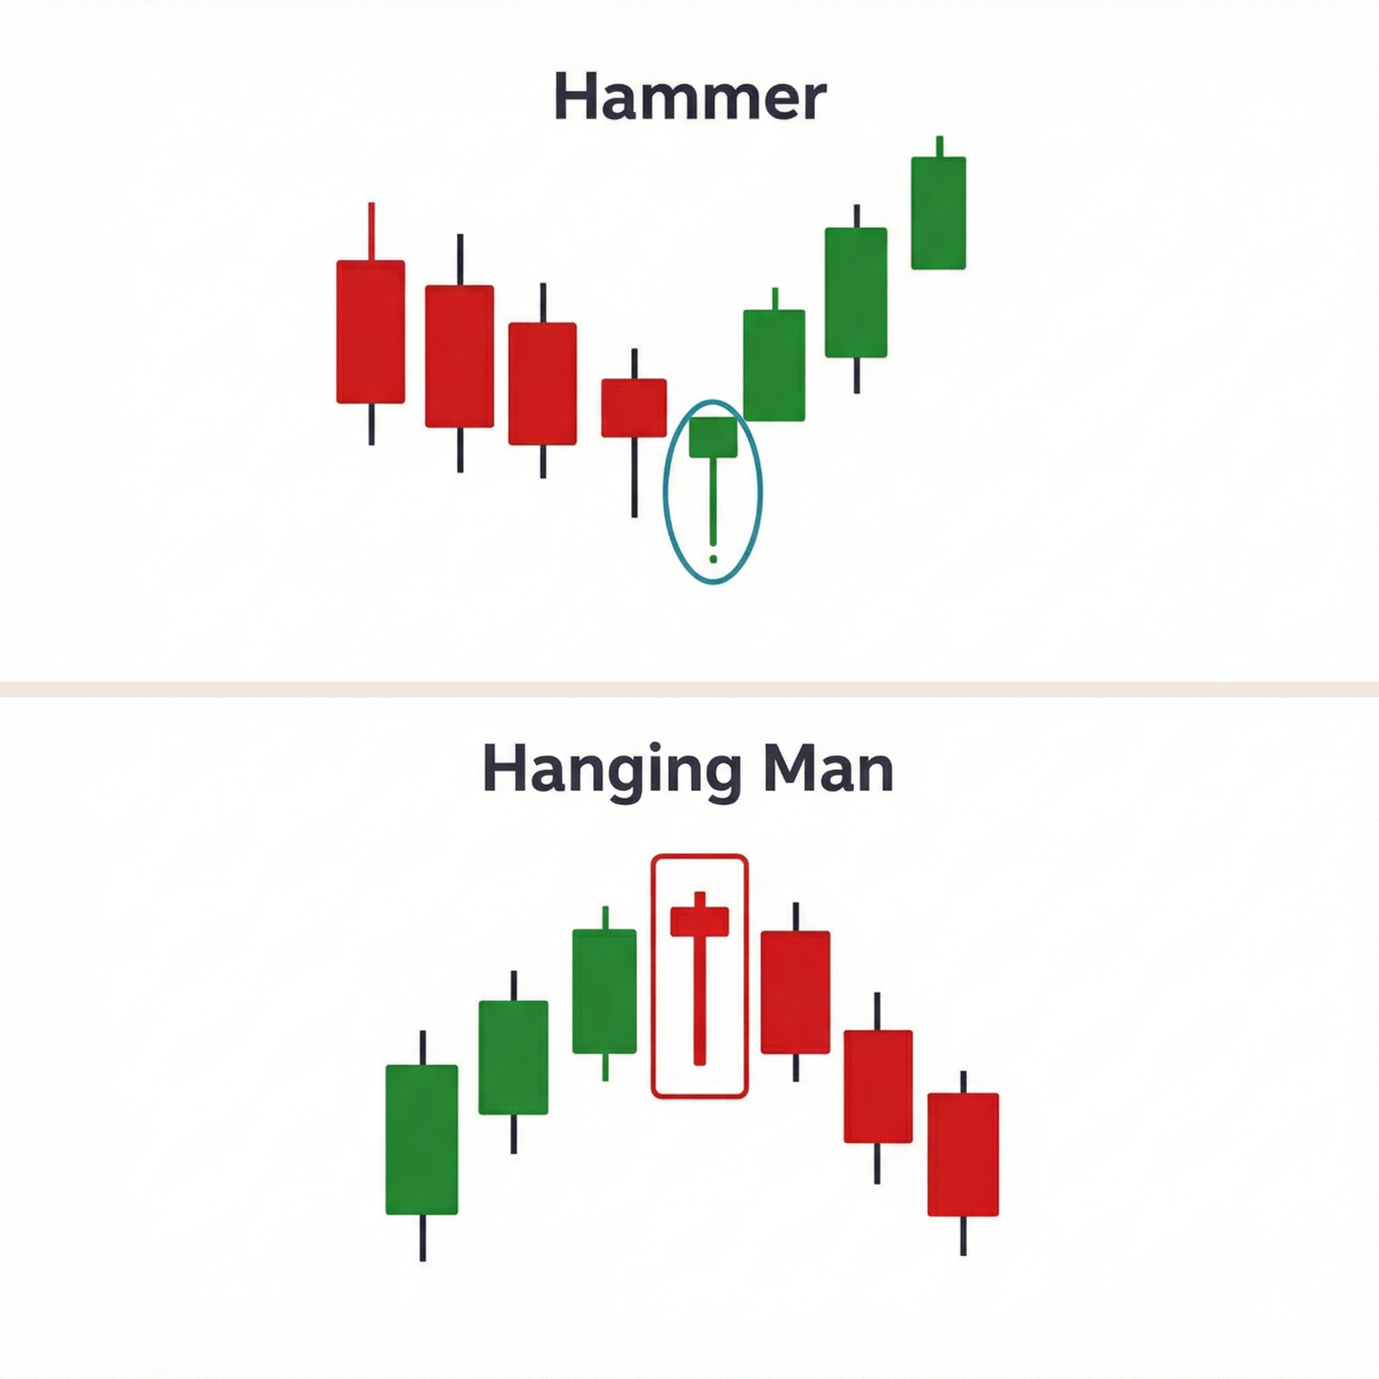
2. HAMMER & HANGING MAN (THE WARNING SIGNS)
These two patterns look the same but appear in different parts of a trend. Their location on the chart changes their meaning.
HAMMER (THE FLOOR)
Snapshot: A downtrend may be approaching a potential bottom.
Spot It:
• Appears after prices have been falling.
• A small body near the top of the candle.
• A long lower wick (the thin line showing the day’s highs and lows) at least twice the size of the body.
Why It Matters:
Sellers pushed prices down during the session, but buyers rejected the lower levels and pushed the price back up. This may suggest that selling pressure is fading.
Trade Trigger:
Consider entering only if the next candle closes higher than the Hammer.
HANGING MAN (THE CEILING)
Snapshot: A rising trend may be losing strength.
Spot It:
• Appears after prices have been rising.
• Same shape as a Hammer.
• Small body near the top with a long lower wick.
Why It Matters:
Even though the market closed near the top, sellers were able to push prices significantly lower during the session. This can signal potential weakness in the trend.
Trade Trigger:
Consider selling only if the next candle closes lower than the Hanging Man.
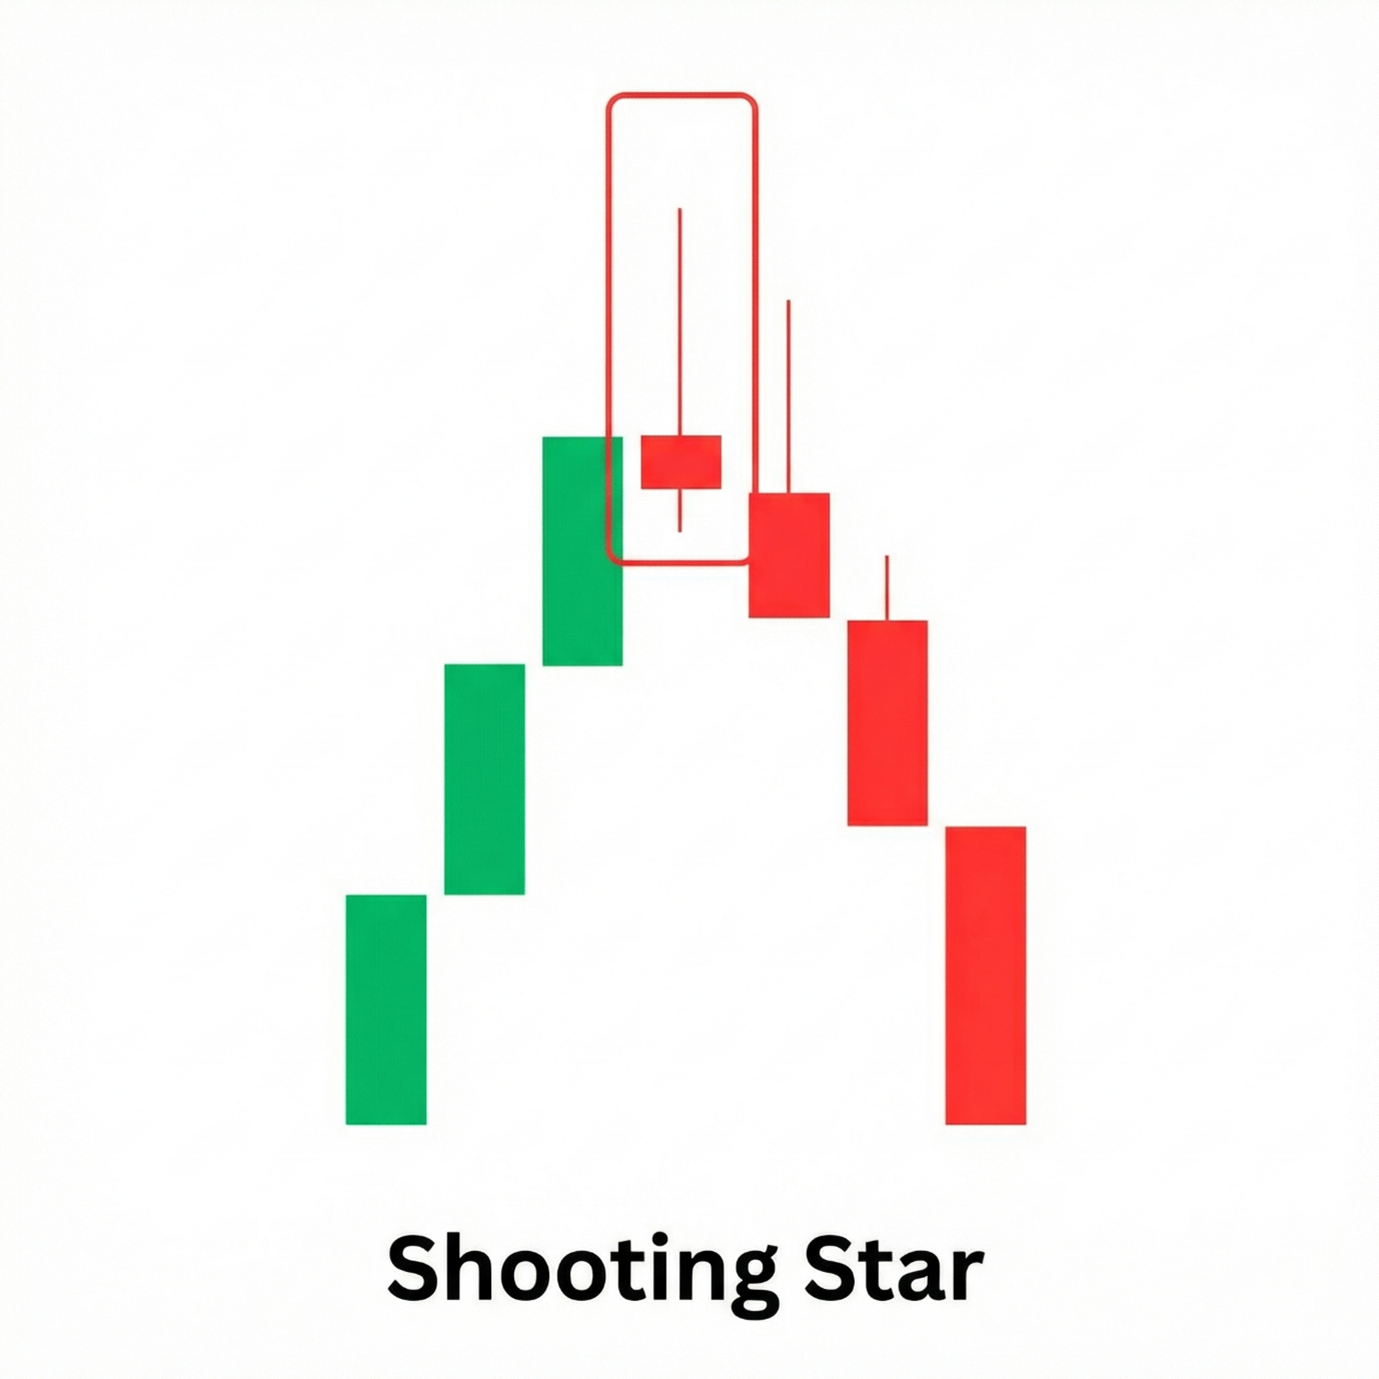
3. SHOOTING STAR
This single-candle pattern often appears when a trend is slowing or struggling to continue.
Shooting Star (The Failed Launch)
Snapshot: A rising market attempts to move higher butgets rejected.
Spot It:
- Appears after prices have been climbing.
- A small body near the bottom of the candle.
- A long upper wick at least twice the size of the body.
Why It Matters:
Buyers tried to push prices higher, but sellers rejected those levels andpushed the price back down. This can signal potential weakness ahead.
Trade Trigger:
Consider confirmation only if the next candle closes lower.
Wrap-Up
Candlestick patterns can help traders understand shifts inmarket sentiment, but they should not be used alone. Waiting for confirmationand checking indicators like volume or RSI can improve decision-making. Over time, recognising these patterns becomes easier and helps traders read market behaviourmore clearly.

Disclaimer: This content is for educational purposes only and does not constitutefinancial advice
Disclaimer
What's Trending
The Dopamine Budget: Why We Crave Spending More Than Saving
December 25, 2025
Recent Blog


.jpeg)
Blog
Recent Blogs
.jpeg)
.jpeg)
.jpeg)

Open your GoPocket Account within 5 minutes.
Have any queries?
Get support
Investing and trading is made simple, affordable and accessible for every Indian.


© Made with ❤️ in Coimbatore, India | Copyright © 2023 onwards, GoPocket.